
Three paths into the methodology
The book teaches the method, a paid diagnostic sets the deeper diagnostic baseline, and the platform measures every week.
The Visibility Score framework is open to you three ways, each with a different depth of result.
The paid diagnostic sets the deeper diagnostic baseline. A website monitored without one takes its first completed cycle as its baseline.
Why this separation matters.
- The book teaches the method, so you can verify our work, run it yourself, or see what we measure.
- The paid diagnostic applies it in full: verified facts, competitor testing, written deliverables and the baseline.
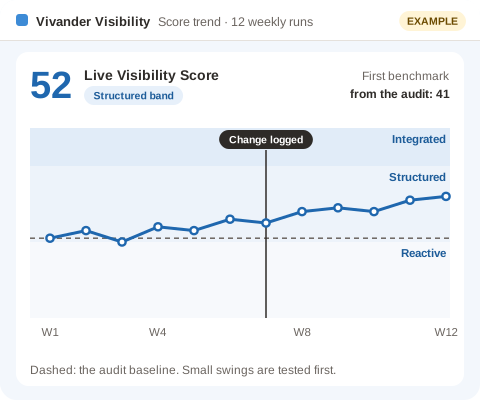
- The platform measures every week, with or without a diagnostic, and keeps the trend against the baseline current.
The Visibility Stack Score (VSS)
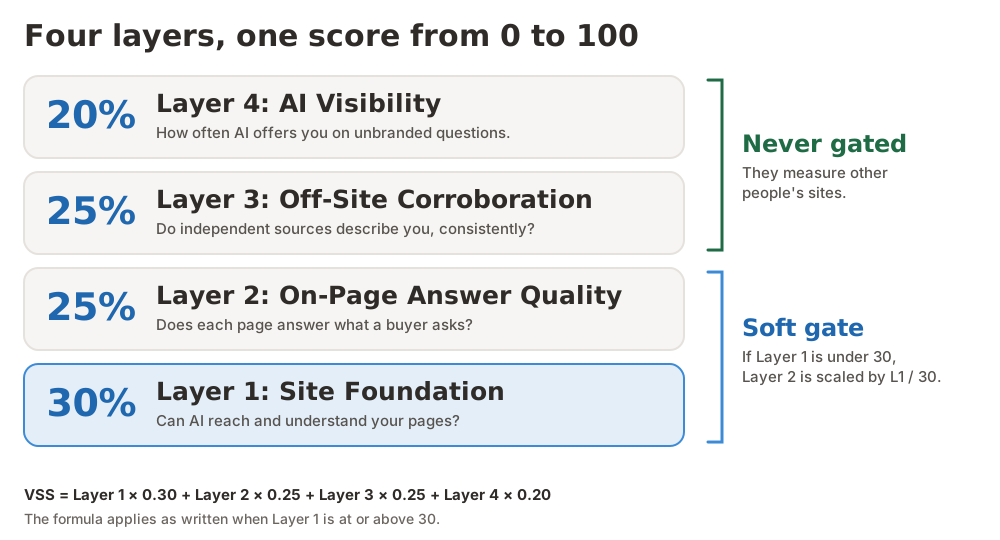
One 0 to 100 score from four layers: your site, your answers, what others say about you, and what AI says.
The diagnostic score, set when an audit is run. A composite 0 to 100 number from four layers.
It measures how AI search systems find, parse, describe, and recommend your business.
Why Layer 1 gates Layer 2 only
- Layer 1 is sequential for your own pages. AI cannot cite (Layer 2) what it cannot reach (Layer 1).
- So Layer 1 carries the highest weight and gates the Layer 2 contribution.
- Layers 3 and 4 measure other people's domains (off-site corroboration and AI mention rate).
- Your site's crawlability does not control those, so they are never gated (Framework v3.2, 2026-07-16).
A site AI cannot crawl can still be described and recommended through Wikipedia, trade press, directories, and Reddit.
The score now says both things when both are true.
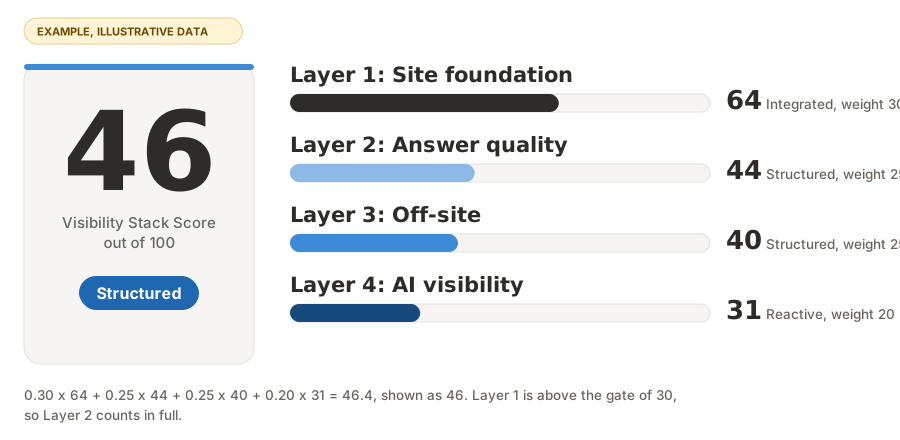
Soft L1 gate: scales Layer 2 only (v3.2). The formula above applies when Layer 1 is at or above the gate threshold of 30.
Below 30 the foundation is broken: robots blocking AI agents, sitemap missing, key URLs returning 5xx. The Layer 2 contribution is then scaled by L1 / 30.
Layers 3 and 4 are never gated. They measure other people's domains, which your crawlability does not control.
An on-page answer-quality score means nothing for pages AI cannot reach. Off-site corroboration and AI mentions can exist for a site AI cannot crawl at all.
The gate is "soft" rather than a hard cliff at 30, so a small L1 regression does not collapse the composite.
| Worked example: (L1, L2, L3, L4) = (10, 100, 100, 100) | Points |
|---|---|
| Layer 1: 0.30 × 10 | 3 |
| Layer 2, gated: (10/30) × (0.25 × 100) | 8.33 |
| Layer 3: 0.25 × 100 | 25 |
| Layer 4: 0.20 × 100 | 20 |
| VSS (not 80, and not the 26 the pre-v3.2 gate produced by suppressing Layers 3 and 4 too) | 56 |
Source: backend/src/services/composite.js §VSS_GATE_THRESHOLD; expected values per Master Framework Phase 6A.
What each layer measures
Layer 1: Site Foundation (Crawlability + Structured Data)
Can AI agents reach and understand your pages? Tested via:
- robots.txt, sitemap.xml, and response codes on key URLs
- Canonical tag correctness and internal linking depth from the home page
- JS rendering for non-server-rendered content, and mobile-readiness signals
- AI-crawler access classification at the CDN edge
- Schema.org markup coverage and JSON-LD validity
- Structured-fact coverage of capacity, hours, address, pricing, amenities, and policies
llms.txt is captured as an informational note, never scored, per Framework v2.5.
A failure here scales the Layer 2 contribution toward zero via the soft gate.
Why it matters: if AI cannot crawl or parse the page, no amount of on-page content quality can compensate. L1 is the floor under your own pages.
Layer 2: On-Page Answer Quality
Does each page answer the questions a buyer would ask? Scored per page on six answer-quality signals (Framework v3.0):
- Citing sources
- Quotations
- Statistics
- Concrete specifics over hedging
- Essential-fact completeness
- Comparison presence
The page set is selected from observed AI citations and buyer-question targets rather than organic rank.
Schema is intentionally Layer 1. L1 is machine-readability (access plus structured meaning); L2 is whether the visible content answers the question.
Why it matters: AI extracts and quotes pages that state the answer directly, with specifics.
Pages that hedge, bury the answer, or omit essential facts like price fail unanimously in controlled testing.
Layer 3: Off-Site Corroboration
Do independent sources talk about the brand, consistently, and in detail? Three sub-components:
| Sub-component | What it reads | Weight |
|---|---|---|
| Presence | Source-type density versus vertical benchmarks: Wikipedia/Wikidata, directories, trade press, review aggregators, LinkedIn, associations, Reddit, YouTube, local news | 50% |
| Consistency | The share of off-site fact assertions that match site-stated facts | 30% |
| Elaboration | Third-party detail the brand cannot credibly add about itself: editorial reviews, journalist commentary, named expert quotes | 20% |
Why it matters: AI weights claims by how many independent sources corroborate them.
A self-asserted fact ("we are the best in town") carries less weight than the same claim across Wikipedia, three trade-press articles, and a guidebook.
L3 is what makes your brand legible to AI as a real, verifiable entity.
How MUCH independent corroboration exists, and how consistent it is.
Scored once at audit time and frozen.
How AUTHORITATIVE those sources are, by tier.
Recomputed live.
Not the same measurement as the LVS component Source Authority, which shares its subject and not its question.
Two numbers about the same corpus, and they are expected to differ.
Layer 4: AI Visibility (Outcome)
The combined outcome layer. Visibility is the percentage of unbranded category prompts where the brand appears (mentioned, cited, or recommended).
It is read across ChatGPT, Claude, Perplexity, Gemini, and AI Overviews.
This is the "did AI surface us" measurement that L1, L2, and L3 together drive.
Why it matters: visibility is the only layer your prospects see. The other three are inputs; this one is the output.
A high VSS with no movement on L4 says the foundation reads well and the sampled answers have not changed.
It does not show that they will change later: the two layers measure different things.
No fixed delay between a site change and a change in AI answers has been established. It differs by platform, by source and by collection method.
Each change is checked with a before and after comparison of the same questions.
How the benchmark is kept
Each layer is scored 0 to 100. Your benchmark is established during the paid diagnostic engagement.
The platform refreshes the Layer 4 quantity with every weekly core cycle, as LVS Visibility Rate over the core cohort (see How monitoring measures visibility).
It shows movement against the benchmark.
VSS bands
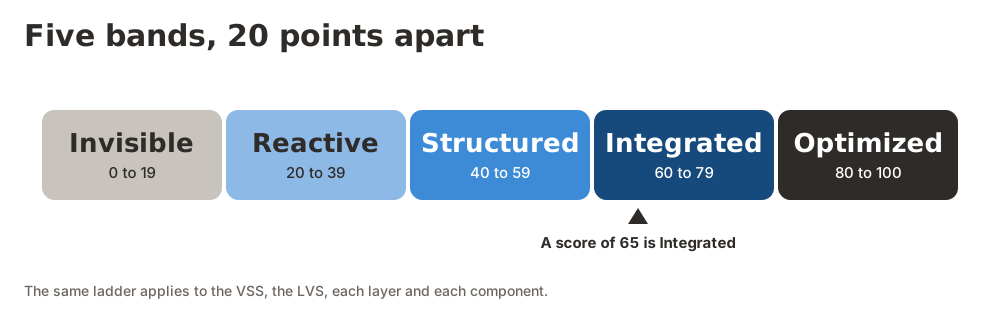
Five bands, 20 points apart, from Invisible to Optimized. The same ladder on every score.
Your composite VSS maps to one of five bands, from Invisible to Optimized.
A band names the range a score falls in. It describes what was observed, not how an organization works.
A band does not show that teams share a priority or that a process is mature.
The ladder is canonical across every 0 to 100 score in the framework since v2.0: VSS, LVS, layers, and components alike.
Most businesses begin in Invisible or Reactive.
The bands exist so "we need to improve" becomes "we need to move from Reactive to Structured."
One ladder everywhere. The platform dashboard and the printed audit deliverable use the same five-band ladder shown above.
See backend/src/services/lvs-v20.js BAND_THRESHOLDS and composite.js bandFromScore. Framework v2.0 (2026-05-08) made this ladder canonical across all 0 to 100 scoring.
A score of 65 is Integrated everywhere today.
Reports from before v2.0
Deliverables produced before 2026-05-08 used a retired ladder. Translate the old band names rather than assuming a score changed bands.
| Retired band (pre-v2.0) | Range |
|---|---|
| Invisible | 0-24 |
| Under-optimized | 25-44 |
| Competitive | 45-69 |
| Leading | 70-89 |
| Reference | 90-100 |
VSS vs. LVS: what the dashboard tracks every cycle
LVS is the score the platform tracks, recomputed every weekly cycle. VSS is the diagnostic score, set when an audit is run.
The four-layer composite, set when an audit is run.
Refreshed when a follow-up audit is commissioned, typically every 3 to 6 months.
Asks: can AI find, understand, describe, and recommend you?
A 7-component score the platform updates from the fixed prompt cohort every cycle.
Computed over the last four completed core cycles.
Asks: what did AI say about you across the window?
LVS, the Live Visibility Score (v2.0 canonical, effective 2026-05-08), has seven components:
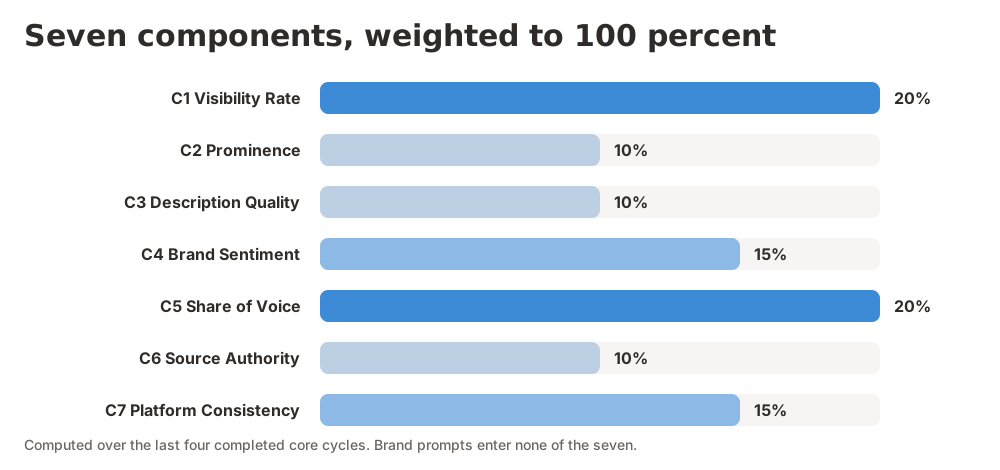
- Visibility Rate (20%) and Share of Voice (20%)
- Brand Sentiment (15%) and Platform Consistency (15%)
- Prominence (10%), Description Quality (10%) and Source Authority (10%)
LVS tracks how the prompt cohort responses move from cycle to cycle.
Scored over everything tested (framework v3.86, 2026-10-13). Prominence, Description Quality, Brand Sentiment and Platform Consistency are the same points summed over the answers that named you and divided by every answer tested (every question tested, for Platform Consistency). A component at 100 means AI did that on every answer, and the gap to 100 is the direction. The average over the answers that named you alone is kept beside each component as the "quality where you appear" reading; it answers whether your reputation is holding where you do appear, and it is not the score.
The 5-component v1.3 formula remains in service as the FROZEN-BASELINE lens for runs captured before 2026-05-08; see backend/src/services/composite.js.
The dashboard tracks the LVS every cycle. Where an audit was run, it also shows the VSS as the diagnostic posture.
The two will not match exactly, because they measure different things.
Testing protocol
A locked set of 24 prompts, five AI tools on every plan, three runs each, every week, worded the same way every time.
Every Visibility Score is computed against the same test structure. That makes scores comparable across cycles and across properties.
Locked, versioned, the same for every plan.
Each prompt on every tool in the plan. Advanced adds Copilot.
On every plan, in three separate passes.
432 on Advanced. The score reads the last four cycles.
- A core cohort of 24 prompts per cycle, locked and versioned, the same for every plan tier (floor 16, cap 32)
- Five AI tools on every plan: ChatGPT, Google AI Overviews, Google AI Mode, Gemini and Perplexity. Advanced adds Microsoft Copilot.
- 7 platforms supported: those six and Claude, an add-on to any plan. Copilot joined on October 4, 2026, and Google AI Mode on October 9, 2026.
- The canonical
PLATFORMS_IMPLEMENTEDset inaudit-pipeline/run_audit.py - Three runs per cell on every plan: 24 prompts × 5 tools × 3 runs is 360 scored answers per core cycle, and 432 on Advanced's six tools
- Taken in three separate passes over the whole cohort rather than back to back, so two samples of a prompt are a pass of work apart
- Weekly core cycles; the live score is computed over the last four completed core cycles
- Watch prompts beyond the core are measured every cycle, on the same instrument, at three runs per cell
- Watch readings are reported prompt by prompt and never scored
- Fresh context / new chat per prompt. Same prompt wording every cycle; a prompt's text is frozen on its first run.
Where the core comes from
The core is drawn from the diagnostic's persona-by-intent grid at the highest commercial weight.
It never contains a branded prompt. The brand cohort (at least twenty branded prompts across ten fact dimensions) is recorded as Brand Recognition and enters no score.
The full rule, the watch list and cohort changes are in How monitoring measures visibility below.
Why fixed prompts. The value of the framework comes from consistency over time rather than comprehensiveness in any single cycle.
Twenty-four fixed prompts tested identically each cycle produce trend data you can act on. Twenty-four different prompts each cycle produce noise.
Visibility Rate: 20% weight
How often AI names you at all, across every question and platform.
How often AI platforms surface your business at all when travelers ask relevant questions.
The foundational component: if you remain invisible, nothing else matters.
v2.0 broadened this from "Citation Rate" to a general appearance rate across every prompt × platform cell.
Citation Rate counted only the cited+recommended tiers on non-brand prompts.
The spec needs to know whether you appeared before measuring how prominently or how richly.
Tier-aware quality moves into Prominence (next section).
Example. Across 100 prompts × 7 platforms = 700 cells, the brand was visible on 266 → (266 / 700) × 100 = 38.
v1.3 historical formula (still computed for frozen baselines): Citation Rate = (cited + recommended) / non-brand prompts × 100.
The two formulas produce different numbers, labeled "v1.3" in the assessment brief and "v2.0" on the dashboard.
Prominence: 10% weight
When AI names you, how high in the list and how strongly it puts you forward.
Where you appear when offered, and how strongly. First position carries more value than fifth, and a recommendation more than a passing mention.
Each offered run scores on two ladders and takes the higher of the two (v2.0; backend/src/services/lvs-v20.js).
Tier points (how the brand was offered)
| Tier | Points |
|---|---|
recommended | 100 |
cited | 60 |
mentioned | 30 |
Rank points (where the brand sits in a list)
| Position | Points |
|---|---|
| 1st | 100 |
| 2nd | 80 |
| 3rd | 60 |
| 4th | 40 |
| 5th or later | 20 |
Prominence = sum(run_score across offered runs) / measurable runs
quality where you appear = average(run_score across offered runs), a reading beside the score (framework v3.86)
The v1.3 formula (position points plus description points, doubled and capped at 100) is retired; Description Quality is its own component below.
Description Quality: 10% weight
When AI names you, how much concrete detail it gives about you.
How richly AI describes you when it does mention you.
A rich description means AI cites concrete services, audiences, or differentiators beyond the name alone.
Distinct from Brand Sentiment (which captures affect) and from Prominence (which captures position and tier).
Every visible mention is classified by the platform into a 5-tier description-quality ladder; the points are summed across visible mentions and divided by every measurable run (framework v3.86), so the score is the share of tested ground captured at that richness:
| Description quality | Points |
|---|---|
| Detailed positive (concrete services, audiences, or differentiators named) | 100 |
| Moderate positive (a few specifics) | 75 |
| Neutral (name + generic qualifier) | 50 |
| Minimal (name only) | 25 |
| Negative (incorrect or harmful framing) | 0 |
quality where you appear = average(description_quality_pts across visible mentions), a reading beside the score (framework v3.86)
New in v2.0. Previously absorbed into Positioning Quality; v2.0 splits it out so the dashboard can flag thin-description issues independently from poor-position issues.
Brand Sentiment: 15% weight
When AI names you, how favorably it speaks about you.
How favorably AI describes your brand when it surfaces you.
A description can be detailed (Positioning Quality covers depth) and still favorable, lukewarm, or negative. Those are independent dimensions.
Brand Sentiment isolates the affect.
Every visible mention is classified by the platform into one of five tiers using a Haiku-class LLM call.
About $0.015 per mention; the figure tracks audit-pipeline/canonical_scoring.py (see the v1.7 Brand Sentiment notes).
The justification is stored alongside the tier, so any score can be traced back to the exact response and reasoning.
| Sentiment tier | Points |
|---|---|
| Positive: recommends, praises, frames favorably | 100 |
| Somewhat positive: competent / standard option without enthusiasm | 75 |
| Neutral: names the brand without evaluative language | 50 |
| Somewhat negative: caveats, concerns, or weaknesses | 25 |
| Negative: clear problem, criticism, or warning | 0 |
quality where you appear = average(sentiment_points across named mentions), a reading beside the score (framework v3.86)
What changed in framework v1.7 (2026-05-04). Component 3 was previously Information Accuracy, a six-category fact-checking score.
Its categories were location, contact, hours, amenities, policies and pricing. It assumed hospitality-shaped facts and needed ground truth most clients did not have.
It saturated near 100 for established brands and did not generalize across verticals.
Brand Sentiment replaces it with a universal, algorithmic, traceable affect score that works for every brand in every category.
Information Accuracy data on pre-v1.7 runs remains as historical context and no longer feeds the LVS composite.
Share of Voice: 20% weight
Your share of the mentions when AI names you or your tracked competitors.
Your share of the AI-response landscape across your own prompt set.
When AI answers questions about your category, how often does it name you relative to your tracked competitors?
Which runs count
- Measured across the non-brand prompts of the core cohort (the core never contains a branded prompt)
- Counted only over runs where at least one tracked competitor is named
- A run that names no tracked competitor is outside the population
- "Competitor mentions" means any time a tracked competitor is named in an AI response
| Example: competitor-named runs in the window | Count |
|---|---|
| Times you were offered | 20 |
| Times competitors were mentioned, together | 60 |
| Share of Voice: 20 / (20 + 60) × 100 | 25 points |
Computed automatically on every run. The platform records which competitors appeared in each AI response, and Share of Voice rolls them up across the window.
No extra test runs against competitors are required. No paid diagnostic is needed to produce a Competitive Context score; a list of tracked competitors is all it needs.
Competitive set tiers
- Primary set (3 to 5 businesses). Direct competitors with similar positioning. Track in the platform.
- Secondary set (5 to 8 businesses). Alternatives customers might consider despite differences. Track if resources allow.
- AI-recommended competitors. The
competitors_mentionedfield shows who AI groups you with, even ones you did not name in advance. - Add them to your tracked list as they surface.
Source Authority: 10% weight
How authoritative the independent sources written about you are.
Are the sources that exist about you authoritative? Every third-party source in your off-site evidence corpus is classified into a tier.
Editorial outlets, government / academic sources, and recognized industry directories score higher than social, generic blogs, or unknown sites.
Source Authority captures the quality of the corroboration that surrounds your brand, beyond the quantity.
What changed in framework v3.22
Graded the domains AI happened to cite inside its answers, which was circular.
A trade feature counted only in a month some platform footnoted it. Press nothing cited was invisible.
Reads your off-site corpus directly.
A source counts because it exists and is verified, whether or not a model cited it that week.
The citation view still ships beside the score as a retrieval diagnostic and never enters the composite.
The two are computed over different populations and are expected to differ.
| Tier | What lives here | Per-domain points |
|---|---|---|
| Tier 1 | Major editorial (NYT, Reuters), recognized industry trade publications, .gov / .edu | 100 |
| Tier 2 | Reputable directories, niche editorial, named-author specialty sites | 75 |
| Tier 3 | General-purpose review aggregators, social, listicles | 50 |
| Tier 4 | Unknown / low-trust / link farms / unverifiable | 25 |
- Volume term: rewards a mix of Tier 1 to 3 sources on a logarithmic curve, so a long tail of identical low-tier sources does not dominate.
- Per-tier caps and a coverage bonus: reward spread across tiers.
- So one Tier 1 outlet does not outscore two Tier 1 outlets and a Tier 2 directory.
A separate diversity multiplier was retired in formula v1.6. That logic now lives inside the caps and the bonus.
Any panel still showing a multiplier is showing a constant.
Detailed math lives in the platform's scoring service; the contract guarantees the result is in [0, 100].
How tiers are stamped. A tier is stamped when the source is collected, from the source-tier registry as it then stood. The registry version is recorded on the row.
If the registry later promotes a domain from Tier 2 to Tier 1, stored rows are not re-scored. Their captured tier is the source of truth.
Re-tiering happens only on a deliberate re-import. Re-scoring an old run produces the same Source Authority value it produced at the time.
Platform Consistency: 15% weight
Whether you show up across all the AI platforms or on one alone.
Are you visible across all the active AI platforms or concentrated on one? New in v2.0.
Two brands can show very different platform patterns:
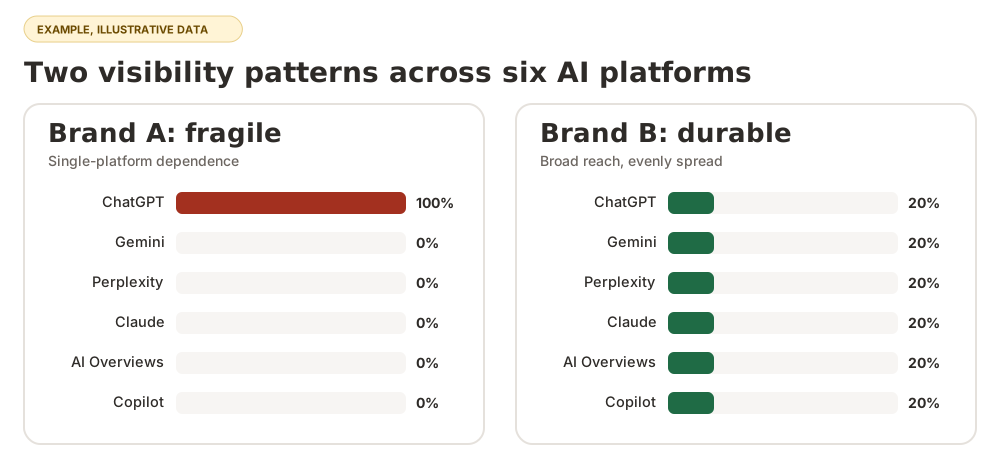
Visibility Rate alone can't distinguish those two postures. Platform Consistency does.
For each prompt tested:
- Count how many distinct platforms surfaced it.
- Divide by the platforms tested for that prompt.
- Average across every prompt tested (framework v3.86; a prompt where no platform surfaced the brand counts zero).
consistency_p = platforms_surfacing(p) / platforms_tested(p)
Platform Consistency = average(consistency_p across every prompt tested) × 100
quality where you appear = average(consistency_p across the prompts where any platform surfaced the brand) × 100, a reading beside the score
Example. The brand is surfaced on 30 prompts out of 100.
| Prompts | Platforms surfacing the brand | consistency_p |
|---|---|---|
| 6 of the 30 | All 6 of 6 | 1.0 |
| 12 of the 30 | 3 of 6 | 0.5 |
| The remaining 12 | 1 of 6 | ≈ 0.17 |
| The other 70 of the 100 | 0 of 6 | 0 |
| Average over every prompt tested = (6×1.0 + 12×0.5 + 12×1/6 + 70×0) / 100 = 14/100 = 0.14 | score = 14 | |
| Quality where you appear = 14/30 ≈ 0.47 over the 30 surfacing prompts (a reading, not the score) | 47 | |
Why it is distinct from Visibility Rate
Visibility Rate is a single rate over all (prompt × platform) cells. Platform Consistency measures how evenly the visible mentions spread across platforms.
A brand can have high Visibility Rate on one platform alone and low Platform Consistency.
Another can have moderate Visibility Rate spread evenly and high Platform Consistency.
How monitoring measures visibility
What the weekly monitor measures, on which settings, over what window, and what it records without scoring.
Between paid diagnostics the platform keeps measuring. This section states what it measures, on which surface, how often, over what window, and what it leaves out.
The full statement, with every source named, is docs/monitoring-methodology.md.
A test parses that document and this section against the code, so neither can drift from the platform without failing the build.
Framework v3.53, effective 2026-09-05.
What is measured
The headline number is the offered rate over measurable runs on a locked cohort.
- Offered: the AI answer put the brand forward as an option, at tier
mentioned,citedorrecommended. - Named and then declined (
named_not_offered) or advised against (negative_mention) is named, and it is not offered. - Measurable: the platform published an answer surface at all. A query with no AI Overview is recorded and leaves every denominator.
- Run: one prompt asked once on one platform, stored with its model and settings.
- Cohort: the fixed, versioned set of prompts the score divides by, the same prompts every cycle.
Four gates decide whether a run is offered
Word-bounded and alias-aware.
Named, and not on offer.
Named, with a warning.
Put forward as a pick.
The four gates run on the stored answer.
Between cited and mentioned, position decides: a URL, domain or bracketed reference within 200 characters after the brand's own mention.
The reference must come before the sentence ends and before any competitor name intervenes. No judge assigns cited.
Platforms, models and settings
The monitor measures the surface a buyer would get on the day it runs.
We read ChatGPT and Gemini the way a buyer sees them, on their public websites. The website chooses the model, and each run records the one it reported.
Perplexity and Claude are asked for each provider's current model. A person who opens ChatGPT today is served whatever ChatGPT serves today.
Every probe reads its settings from one configuration file (audit-pipeline/capture_config.py, version 2026-10-09.2). Each run records the model that answered it.
A change of model is a break
The providers move these models when they choose, so a move is treated as a break rather than as a result.
No change is reported between two readings when the model answering a platform changed between them. A change of prompt set or platform set gets the same refusal.
A score computed across four cycles says so when a platform was answered by more than one model inside them.
A model nobody recorded is not a model that changed, and readings from before the model was stored are reported as unknown rather than counted as a change.
A change of AI tools is a break too. On October 4, 2026 Microsoft Copilot joined the monitored set as a sixth platform.
It is read from Copilot's own page through SerpApi, with a fresh answer on every run.
A rate read with Copilot divides by a different set of AI tools than one read without it. So:
- No change is reported across that date.
- A score computed across four cycles says so while the cycles straddle it.
- The run-to-run comparison uses only the questions and tools both runs answered, and names the tool it left out.
- The trend chart draws the segment across the change as a break rather than a move.
Two more breaks on October 9, 2026. ChatGPT and Gemini moved from the developer API to their public websites.
Google AI Mode joined the monitored set the same day, read through DataForSEO's search results API at 0.4 cents a search.
No change is reported across that date on ChatGPT or Gemini, or on any rate that divides by the set of AI tools a cycle asked.
| Platform | Model asked for | Temperature | Retrieval | Location |
|---|---|---|---|---|
| ChatGPT | none; the public website chooses (it reported gpt-6 on October 9, 2026) | not sent | forced on, on every role | country as a DataForSEO location_code, no city, on every run, core and watch alike |
| Perplexity | sonar-pro | 1.0 | always searches | none |
| Gemini | none; the public website chooses (it reported 3.5 Flash-Lite on October 9, 2026) | not sent | the website's own search | country as a DataForSEO location_code, no city, on every run, core and watch alike |
| Claude | claude-sonnet-5 | 1.0 | web search tool on the request, capped at two searches a run | none |
| AI Overviews | none; a Google search feature read from the search page | n/a | Google's own | country mapped to a Google search location (location_code) |
| AI Mode | none; a Google search mode read through DataForSEO's search results API, since October 9, 2026 | n/a | Google's own | country mapped to a Google search location (location_code) |
| Copilot | none; Microsoft names no model, and the answer is read from Copilot's page through SerpApi | n/a | Copilot's own | none |
Temperature and retrieval
On Perplexity and Claude the temperature is the providers' consumer default, stated so it is on every row.
ChatGPT's and Gemini's public websites take no temperature, so the row records none for them.
Every analysis step that reads an answer (tier, sentiment, canonical scoring, signals) runs at temperature 0.
What temperature 0 buys is a stated setting and less variance across readings; it does not buy sameness.
The Master Framework cites Kirsten et al.: 9 to 28 percent of decisions change even at temperature zero, and the design is built on that figure.
Retrieval is what lets a probe see the client's site and citations.
In testing, a probe without retrieval answered from what the model had memorized and did not reflect changes made to the site.
In the measurement of 5 September 2026, on the API, 11 of 16 ChatGPT runs and 16 of 16 Gemini runs searched when retrieval was on.
On the public website, every ChatGPT request forces a search. Gemini's website decides for itself whether to search.
Location. ChatGPT and Gemini take the client's country as a DataForSEO location code. The public website takes no city.
So every run on ChatGPT and Gemini, core and watch alike, carries the client's country and is measured where the client's buyers are.
Until October 9, 2026 ChatGPT's API search took the country and city, and Gemini carried no location.
Until 6 September 2026 a watch run on ChatGPT carried no location, because it carried no retrieval either.
AI Overviews and AI Mode map the client's country to a Google search location. ChatGPT and Gemini use the same table. Nine countries are mapped.
A client outside that table is measured from the United States, with geo_method = default_unknown on the row.
Perplexity and Claude carry no location.
Copilot carries none either: the engine that reads it takes no location, and Copilot answers in the language of the question.
The consumer surface, and the control that watches it
ChatGPT and Gemini are read on their public websites through DataForSEO's LLM Scraper, at 0.4 cents a run. The website brings its own model, search and place cards.
Place-card names are read into the answer text. The citations are the sources the answer cited.
Since framework v3.80 the paid audit reads ChatGPT and Gemini on the same public websites, so an audit baseline and monitoring measure the same surface.
An audit run before v3.80 asked their APIs, and is not comparable like for like on ChatGPT and Gemini.
Perplexity and Claude are asked for the provider's current model, at the consumer default temperature, with search on.
Set DATAFORSEO_SURFACE_CHATGPT or DATAFORSEO_SURFACE_GEMINI to api and that platform goes back to the API, on gpt-4o or gemini-2.5-flash.
Two things still separate it from the app a person opens:
- The app carries a signed-in person's history, and the probe carries none.
- The app may decide per query whether to search.
The model is no longer one of them.
Until 6 September 2026 the ChatGPT probe asked for a dated snapshot while the other three asked for moving aliases.
So the pinned instrument these pages described was true of one platform of four.
A moving instrument cannot tell you how far it has moved, so a quarterly control run measures a fixed reference beside it.
On the 4th through the 10th of January, April, July and October, each client's core cohort is run once more on the control model set.
The control is the API reference held still: ChatGPT on the dated gpt-4o-2024-11-20 snapshot.
The public website takes no model. Since October 9, 2026 the control reaches that snapshot only while the ChatGPT probe is set to the API.
Each platform is reported one of five ways.
| Reading | When it applies |
|---|---|
| Instrument drift | The monitored rate minus the control rate. Only ChatGPT has a dated snapshot on offer, so only ChatGPT can show drift. |
| Same instrument: run-to-run variance | Gemini, Perplexity and Claude have no snapshot, and AI Overviews, AI Mode and Copilot name no model. The reading is one instrument measured twice. |
| Suppressed | A platform below the minimum-n floor on either side, and it says so. |
| No comparison | One side measured nothing. |
| Unknown | One side recorded no model (a core cycle run before probe settings were stored). An unrecorded model is not a different model. |
The control run carries source = 'calibration' and every scorer excludes that source. It never enters a score.
Grok is outside the monitored set until a collection path exists. Copilot joined it on October 4, 2026, and Google AI Mode on October 9, 2026.
How often, and what a cycle is
A cycle is one complete core run: every core prompt on every active platform, at three runs per cell.
Three runs per cell is the setup on every plan. In testing, we observed that answers vary between tries, so two answers out of three decide each cell.
The choice of two or one run per cell offered in framework v3.78 was withdrawn in v3.79.
The runs are taken in three separate passes over the cohort, so that a prompt's samples are not adjacent in time.
This is about independence, not speed. Samples taken seconds apart can share a cached retrieval state.
They would then be less independent than the interval reported over them assumes.
The spacing costs nothing and adds no waiting, because it is the rest of the cohort being measured.
The weekly core and the watch list
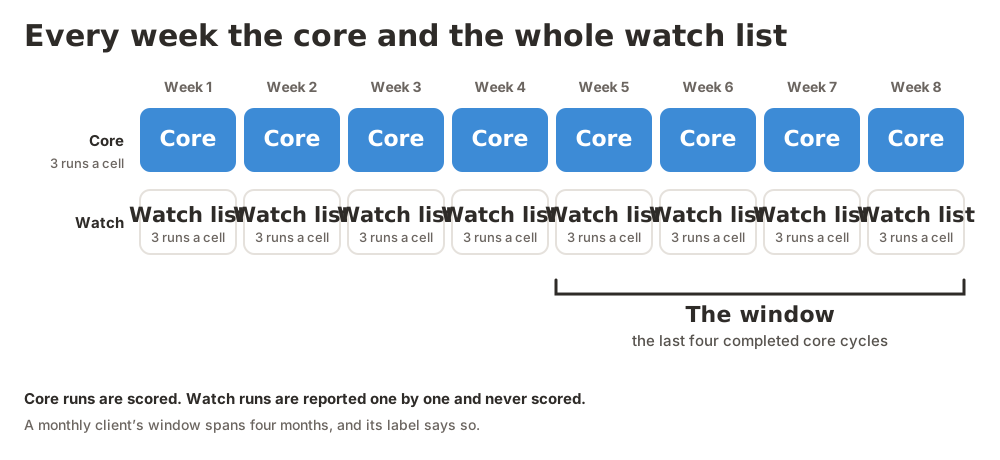
The core runs weekly. The plan's watch prompts outside the core run in the same cycle, every one of them, at three runs per cell.
Before framework v3.79, the watch slice ran in four groups at one run per cell. Since v3.79 the whole list runs every cycle.
Watch breadth is what the plan changes:
- Starter watches 26 prompts beside the core.
- Pro watches 126.
- Advanced watches 226.
- Agency and Enterprise are built to order.
Every tier gets the same core. Watch runs feed the per-prompt view and the answers feed and enter no composite. See the plans page for the tiers.
What a watch run is
A watch run uses the same instrument as a core run: every platform you have enabled, retrieval exactly as a core run sets it.
It takes the same samples too: three runs per cell, with two answers out of three deciding each result.
What differs is the score. A watch reading is reported prompt by prompt and enters no composite.
Promoting a prompt into the core puts it in the score from the next cycle, under a new cohort version.
Until 6 September 2026 a watch run switched retrieval off on ChatGPT and Gemini, because retrieval is where the cost is.
Measured on 5 September 2026, it adds 5.4 cents per ChatGPT run and 3.6 cents per Gemini run, 44 times the model change alone on ChatGPT and 20 times on Gemini.
That was reversed for a reason that is not about cost. A prompt measured on a different surface cannot be compared with the diagnostic or the core numbers beside it.
And a prompt where AI offered the brand only because it searched read as invisible without retrieval. That hid the prompts a watch slice exists to find.
What a monitored client costs
One weekly core cycle carries 27 prompts: the 24 scored core prompts, plus three brand prompts measured alongside them and recorded rather than scored.
On the five AI tools every plan includes, at three runs per cell, that is 405 answers a cycle, before the watch list.
On all seven supported platforms it is 567 answers, which comes to about $9 a cycle.
Custom plan and run credit prices are computed from these measured per-engine rates and are listed on the pricing page.
Starter, Pro and Advanced are set prices, held above their measured cost.
Claude, ChatGPT, Perplexity, Gemini, AI Overviews, Copilot and AI Mode were measured. Copilot's rate is its search provider's plan rate, 1.5 cents a search.
Since October 9, 2026, ChatGPT and Gemini are asked on their consumer websites, the answer a buyer gets, at 0.4 cents a run.
Claude is the dearest at 6.7 cents a run: no provider sells its answers at a flat rate, so we pay Anthropic per search and per page read. We add it at that cost.
AI Overviews, AI Mode, ChatGPT and Gemini are the cheapest at 0.4 cents, bought as finished answers.
Google AI Mode joined on October 9, 2026, at 0.4 cents a search: 81 more runs a cycle, about 32 cents.
AI Overviews is read from Google's search page, with the overview loaded in full: 0.4 cents with an overview, 0.2 without.
The arithmetic is in docs/measurements/monitoring-cost-2026-10-10.md.
The window
The live score is computed over the last four completed core cycles.
Every component is computed from the runs of those four cycles and no others. The number changes when a cycle lands and at no other time.
Two reasons the window is measured in cycles:
- A sliding calendar window changed the published number on days when nothing was measured, as a cycle aged out overnight.
- The same aging could flip a component across the minimum-n gate between two days on which nothing ran.
Four weekly cycles is the span the old 30-day rule was meant to cover, anchored to measurements.
On a custom monthly plan the window spans four months, and the label says so.
A client with fewer than four core cycles is computed over its last four completed runs of any role except watch. A paid diagnostic counts.
| Situation | The label reads |
|---|---|
| Four core cycles | "last 4 measurement cycles (N runs, DD Mon to DD Mon)" |
| Fewer core cycles | "k of 4 measurement cycles so far" |
| Computed over runs of other roles | "completed audits" in place of "measurement cycles" |
The seven components
Weights from backend/src/services/lvs-v20.js; each component's question is stated in its own section above.
A component measured on fewer than ten qualifying cells renders as insufficient data with its n shown.
The composite then reweights across the components that did compute: the weighted sum divided by the sum of the present weights.
A 0 is a measured value and stays in; a null is an absence and leaves. The n prints beside every component.
The band ladder is the one shown under VSS bands above, at 20-point intervals, shared by every score on the platform.
Recorded and never scored
- The brand cohort. At least twenty branded prompts across ten fact dimensions, read as Brand Recognition beside unbranded visibility.
- A prompt naming the brand is easy to appear in, and the inflation would scale with the cohort. So brand prompts enter no numerator or denominator of any score.
- The core never contains a brand prompt.
- The watch slice. Recorded for the per-prompt view; never in the window.
- The 14-category signals. Extracted on every offered run of a diagnostic, and on a deterministic 20 percent sample of monitoring runs.
- The sample is chosen by a hash, so the same run is always in or always out. A run sampled out says so on the row.
- Social corroboration and placements. Where the brand's profiles exist and whether earned coverage landed on the domains AI cites. Each is a series of its own.
- The control run. The quarterly per-platform reading against a pinned reference model, on a run that carries
source = 'calibration'. - It reads instrument drift only where the two sides used different models, and run-to-run variance everywhere else. Published beside the score, never inside it.
- The fleet canary. One control prompt per platform per day; a fact about the apparatus, never about a client.
named_not_offeredandnegative_mention. Named, and not offered. Shown in the tier distribution.- They stay in the denominator, because the brand was measurable, and out of the numerator, because it was not put forward.
Uncertainty
An interval says how far the true value could sit from the number printed, on the evidence in the window.
A Visibility Rate of 47 with an interval of 42 to 52 reads: the score is 47, and on this evidence it could sit anywhere from 42 to 52.
A movement that stays inside that span has not yet shown itself to be a movement.
| Components | Interval |
|---|---|
| Visibility Rate, Share of Voice, Platform Consistency (rates) | A Wilson interval on their own denominator |
| Platform Consistency, in particular | An approximation (a mean of per-prompt proportions read as one binomial), labeled as one |
| Prominence, Description Quality, Brand Sentiment (means over cells) | A t-interval |
| A component suppressed under the floor | No interval |
Every per-platform, per-bucket and per-prompt cut carries its own n and is suppressed below the same floor.
The provisional band. When the composite sits within 3 points of a band boundary the page carries the framework's sentence:
"This score sits within sampling variance of the [band]/[band] boundary.
Treat the band assignment as provisional; the direction of movement across re-tests is the reliable signal."
When a prompt is added or the cohort changes
Editable, never run.
Approved.
Measured every cycle.
Scored, from a cohort event.
A prompt is draft, then ready, then in the watch slice, then, at a cohort event, in the core. Its text is frozen on its first run.
Anyone with access to the client can mark a prompt ready.
Moving a prompt into or out of the core is a cohort write and requires an administrator. Each cohort version records who wrote it.
Any change to the core writes a new cohort version with a reason.
For the first window after it, the platform computes the composite on both the old core and the new core over the same cycles, and stores the offset.
The trend chart draws a marked break at the event. Across a change with no bridge the platform refuses to print a difference.
That cell reads "not comparable: cohort v1 to v2" and carries no number.
A cell that reads not comparable records a change of cohort between the two readings and says nothing about the business.
What a failure looks like in the data
A probe that fails gets one retry. A run that fails both attempts is a row in visibility_run_failures with its error class.
So the denominator is explicit: expected = runs + failures.
A run that did not measure everything it set out to publishes as partial, with a reason. A partial run never overwrites a baseline.
| Partial reason | What it means |
|---|---|
reduced_run_depth | Run with fewer runs per cell than the depth the run's role asks for. |
empty_slot | The cycle's watch list held no prompt, so it measured nothing. |
cost_ceiling_reached | Spend reached the per-run ceiling, default 30000 cents. The run stops before the next sample. |
- A stopped run records the runs it did not take, naming the cells it never reached and the cells it left short of their depth.
- The ceiling is at least 4 times a measured weekly core cycle, so it is a runaway guard rather than a budget.
- A run whose estimate already exceeds the ceiling refuses to start.
A run where the platform published no answer surface is stored, leaves every denominator and is reported as unmeasurable.
Flags on a run
model_mismatch: answered by a different model than requested.analysis_degraded: the analysis ran on a fallback model. Both flags are stored on the run row.- A degraded run leaves the six judged components and stays in Source Authority.
- Source Authority's cohort is the citations the platform returned, not anything an analysis step decided.
- Every row measured so far carries the flag false.
The fleet canary
A fleet canary runs daily at 5am Eastern: one control prompt per platform about the Eiffel Tower, a subject every platform answers.
It runs through the same probes the pipeline uses. A person is alerted when:
- A platform fails on two consecutive runs.
- Every platform fails on one run.
- Or at least two of the clients measured that day, and at least half of them, sit below their own threshold.
Below threshold means more than three of their own standard deviations under their own trailing mean, or under a constant history that has never moved.
That is read over the eight weeks of completed core cycles before that day.
Each client is compared against itself. Core cadences are staggered, so the set of clients measured changes daily and a fleet average would move on that alone.
The check needs two comparable clients and three trailing observations per client. Short of that it reports that it could not check, and names the counts.
The window is eight weeks of calendar time rather than the last eight days any client ran. Staggered cadences make those two very different spans.
A check that has been unable to run for more than ninety days alerts on that fact.
A platform returning nothing for everyone is a capture-failure hypothesis before it is a finding.
The sampling-adequacy disclosure
The Master Framework requires every deliverable that reports a stability figure to carry this sentence:
The four-cycle window is the compensating design for monitoring:
| Runs per cell | Count |
|---|---|
| Per core cycle | 3 |
| Cycles per window | 4 |
| Per window | 12 |
| Published recommended minimum | 7 to 8 |
The runs spread across four weeks, so the window sees week-over-week drift that a single-day sample cannot.
Within one cycle the runs of a cell, three, are taken in separate passes over the cohort rather than back to back.
That does not raise n, and it is not there to make the run faster.
It is there so three samples averaged as if they were independent are not three readings of one cached retrieval state.
In testing we observed that the same prompt on the same platform returns different source sets on different days.
That is why the window is the unit to read. A single cycle is one sample of it.
Signals, units and versions
Four separate signals, two units, and the versions every card and export carries.
The dashboard reads each answer for four signals. Each is read on its own, and none is a stage of another.
A citation is not a step between a mention and a recommendation.
- Named anywhere. The answer names you at all, including a name with no offer and an answer that advises against you.
- Offered as an option. The answer puts you forward as a candidate. More than a name, and not necessarily an endorsement.
- Explicitly recommended. The answer endorses you. A recommendation with no link to your site still counts here.
- Own website cited. The answer links at least one of your own pages, whatever else it says about you.
Two units
Answers: every eligible answer counts once.
Question-and-tool cells: one question on one AI tool in one run. A cell carries a signal when more than half of its eligible answers do.
The two units are printed apart and never compared.
Which questions count as discovery
A question's wording decides, not the folder it was filed in.
A question that names you, such as a comparison of you with a rival, is read on its own and never counts as discovery.
A question filed under Brand that does not name you is in neither group until it is revised. The question's intent is shown beside it and does not decide its group.
The Live Visibility Score keeps the framework's own rule, which removes the questions filed under Brand.
Each score card says how many answers it still counts to questions whose wording names you.
Repeats and failed attempts
A failed attempt is not an absence. One appearance, one absence and one timeout read "1 of 2 successful responses; 1 failed attempt". Three answers that leave you out read "Not mentioned: 0 of 3 answers": an omission is a result, and a failed attempt is stated after it on its own.
With no successful response, a reading is not measured. It is never shown as zero.
Three repeats in one run, or four cycles in one window, share questions, tools and collection method.
They are not independent samples. Agreement among them describes those runs, not a settled position.
Missing components
A score component that could not be measured is left out. The measured weights are divided by their total, so it is never scored as zero.
A score over fewer components cannot be compared with one over all seven.
Versions
Metric contract 1.1, cohort cohort-2026-10-16.1. Every card and export states the versions it was computed under.
When a rule changes, earlier readings are not rewritten in place. A card recomputed under a new version says so and states how many answers moved.
How to read the score
Small swings can be noise, no fixed delay applies to every change, and a flat total can hide moving parts.
Small swings can be noise
In testing, we observe readings that move from run to run with no change on the business's side.
How far they move depends on the metric, the number of answers and the AI tool. No single number of points applies to every reading.
A change is read from a comparison of the same questions on the same tools (see How monitoring measures visibility), never from the size of the move alone.
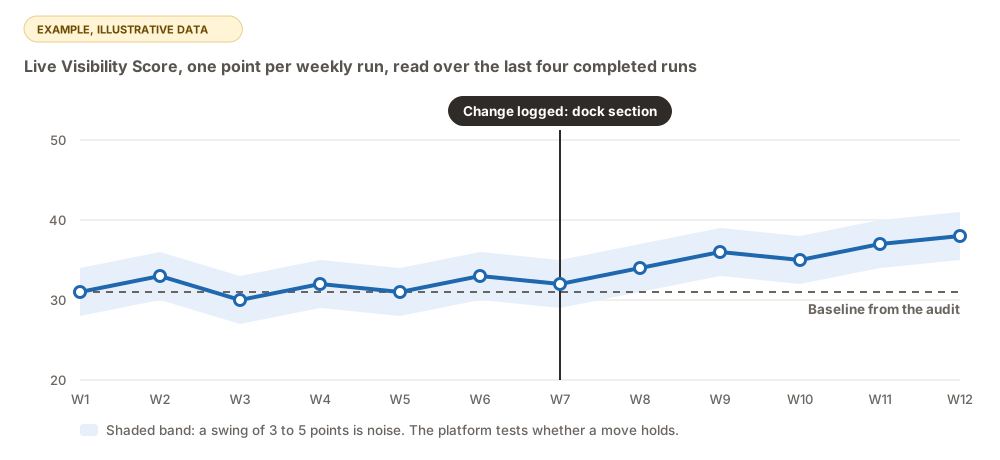
Focus instead on:
- Trends over three or more months showing sustained improvement or decline
- Component-specific insights revealing which dimensions need attention
- Competitive gaps requiring a strategic response
- Business metrics read beside the components, as observations to test, not as proof of cause
No fixed delay
No fixed delay between a site change and a change in AI answers has been established.
In testing, we observe that it differs by platform, by source and by collection method.
Each change is read with a before and after comparison of the same questions, and the comparison states when the readings cannot be compared.
A score that has not moved after a change does not show that it will move later, and a score that moves after a change does not show that the change caused it.
Component masking
One dimension improving while another declines produces a flat composite. For example, a property might see:
Positioning Quality rose through content differentiation.
Competitive Context fell because a competitor launched its own optimization.
The overall score barely moves.
The component breakdown shows which parts moved. It does not show what moved them.
A rise after your work and a fall after a competitor's change are associations, and each is worth testing.
During plateaus, the component-level analysis matters more than the headline number.
What the score doesn't prove
The score measures what AI says. It does not prove what caused a booking or a sale.
The Visibility Score measures AI visibility outcomes. It does not prove causation for booking revenue or any downstream business metric.
Discovery happens privately across AI platforms, through pathways too complex to track with attribution certainty.
Track booking patterns alongside Visibility Score improvements as correlated evidence, never as causal attribution.
When Citation Rate rises 15 points and direct bookings rise the same quarter, that is a pattern worth noting and a hypothesis worth testing.
It is not a proven causal chain.
The Visibility Score gives you measurement capability where none existed before. It does not claim to measure what it cannot measure.
Click the lightbulb in the bottom-right corner. The assistant sees your page and knows your data.
For other topics (billing, team, troubleshooting), visit the FAQ.