
The INVISIBLE Framework
This platform puts into practice the method in Invisible: What to Do When AI Erases Your Business by Michael J. Goldrich.
The book is the first comprehensive framework for measuring and improving AI visibility. Every score, pillar and opportunity on this site traces back to it.
The Discovery Crisis
For two decades, visibility and SEO meant the same thing, because search engines dominated discovery. That era is ending.
Buyers now ask ChatGPT, Gemini, Perplexity and Claude for recommendations.
Returns a list of links. The buyer opens several and compares.
Builds one answer, names specific businesses and says why. A business left out of that answer does not exist for that buyer.
From Funnel to Spiral
The marketing funnel assumed a linear path: awareness, consideration, decision, purchase. AI discovery replaces it with what the book calls the Answer Spiral.
A wide first question.
Each follow-up narrows it.
The AI does the considering. The buyer leaves with a choice.
The funnel assumed you controlled each stage: ads, your website, your booking engine. The Answer Spiral removes that control.
AI platforms combine dozens of sources into one recommendation and present it as a definitive answer. The decision happens inside the conversation.
The measurement gap
Traditional analytics cannot detect AI-driven discovery. A buyer who found you through ChatGPT and then booked on an OTA appears as an OTA booking.
The AI conversation that created the awareness never appears in your data. The attribution signal was never there to begin with.
Vivander Visibility replaces guesswork with structured measurement, on the two scores set out below.
The five score bands
Every score on this site is a 0 to 100 number, and a band names the range it falls in.
A band describes the visibility observed in the answers tested.
It does not describe how your organization works. A band does not show that teams share a priority or that a process is mature.
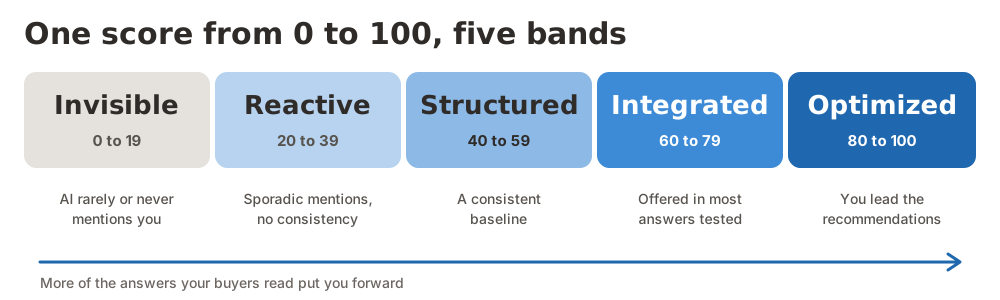
- Invisible (0 to 19): in the answers tested, AI rarely or never mentions you.
- Reactive (20 to 39): you appear in some answers tested, without consistency.
- Structured (40 to 59): you appear consistently in part of the answers tested.
- Integrated (60 to 79): you are offered in most answers tested, across the AI tools sampled.
- Optimized (80 to 100): you lead the recommendations in the answers tested for your segment.
The core principle
In testing, we observe that the same question asked twice can get a different answer, citing different sources.
A platform that shows precise AI visibility numbers without showing how much they vary is hiding the uncertainty.
Vivander Visibility runs each query several times, aggregates the results and shows you confidence intervals.
When a number is reliable, you see that. When it is directional only, you see that too.
About probabilistic metrics
Every rate is aggregated across the runs per prompt on each platform, three. The score is printed with its sampling disclosure.
Wide intervals mean the metric is directional. Narrow intervals mean it is reliable.
Two scores: VSS and LVS
The Live Visibility Score is tracked every weekly cycle. Your first completed cycle sets its baseline.
The Visibility Stack Score is set by an audit, if you have one, and sits beside the live score.
The Visibility Stack Score (VSS)
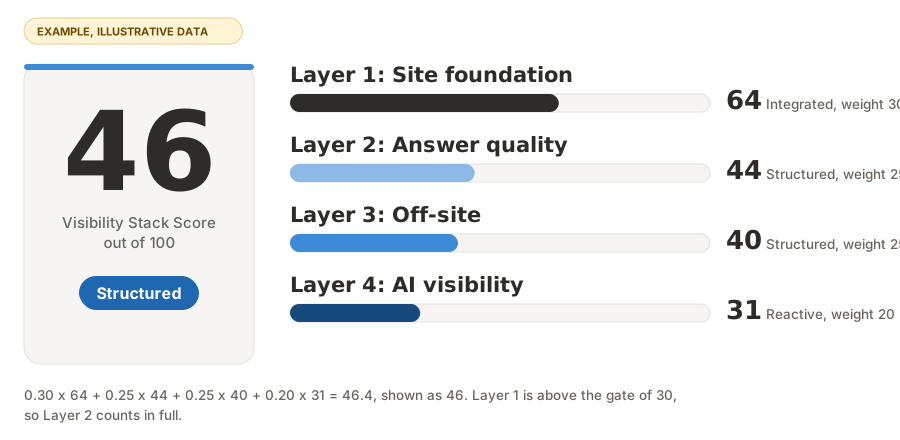
One 0 to 100 score from four layers: your site, your answers, what others say about you, and what AI says. It places you in one of the five bands above.
| Layer | Weight | What it measures |
|---|---|---|
| Layer 1: Site foundation | 30 | Whether AI crawlers can reach and read your pages. |
| Layer 2: Answer quality | 25 | Whether your pages answer what buyers ask, with facts an engine can lift. |
| Layer 3: Off-site corroboration | 25 | Whether other sources describe you, and agree with your site. |
| Layer 4: AI visibility | 20 | How often AI offers your business when buyers ask without naming you. |
When Layer 1 is under 30, a soft gate scales the Layer 2 contribution down, because AI cannot quote a page it cannot reach.
Layers 3 and 4 are never gated.
The Live Visibility Score (LVS)
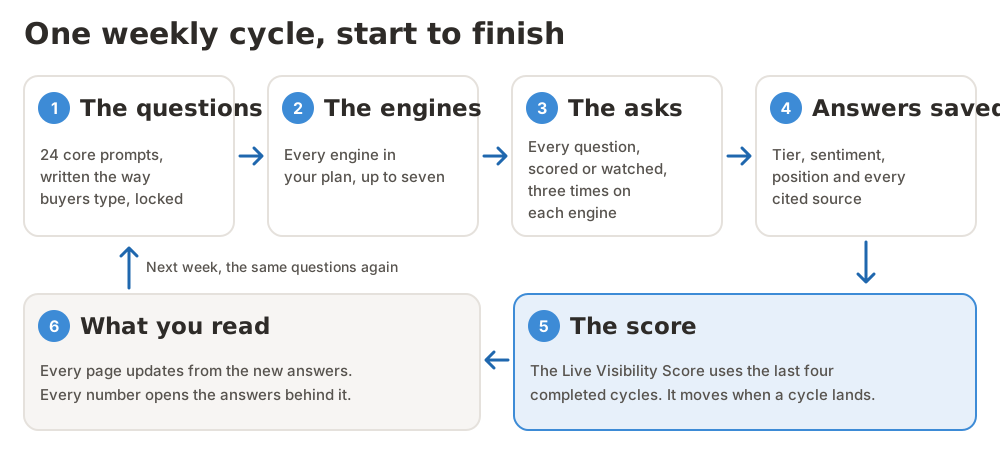
Recomputed every weekly cycle on a locked core of 24 prompts, over the last four completed cycles. It combines seven components:
| Component | Weight |
|---|---|
| Visibility Rate | 20% |
| Prominence | 10% |
| Description Quality | 10% |
| Brand Sentiment | 15% |
| Share of Voice | 20% |
| Source Authority | 10% |
| Platform Consistency | 15% |
The methodology explains each layer, the difference between the two scores and each component.
How often each question runs
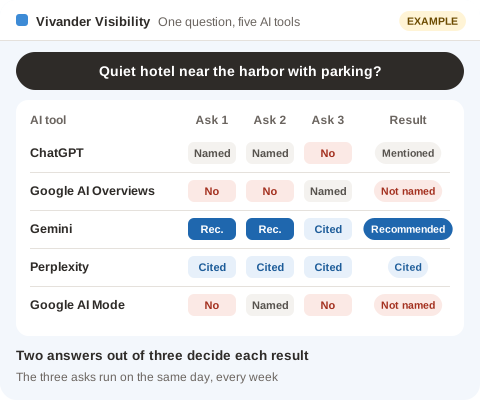
Every prompt, core or watched, is asked three times on each platform, every cycle. Two answers out of three decide each result.
The score uses the core alone. The core is the same 24 prompts on every plan, so scores compare across plans.
Watch prompts run every cycle too, at the same three asks. A watch reading is reported prompt by prompt and never scored.
Tier classification
Every time your brand appears in an AI response, we classify how it was treated.
- Invisible. Not mentioned at all.
- Mentioned. Named in passing, no endorsement, no source.
- Cited. Named with a source URL or explicit attribution.
- Recommended. Explicitly endorsed, recommended, or framed as a top choice.
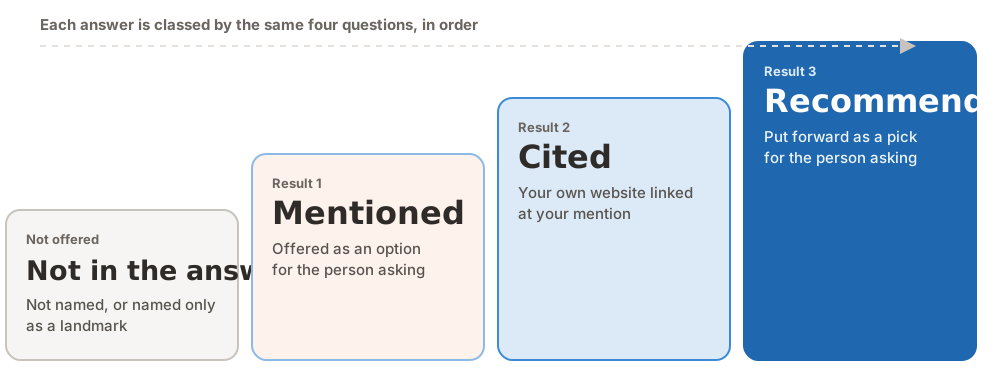
Four gates on the stored answer decide whether it offers you:
- Is the brand named at all?
- Is it named and placed outside what is on offer?
- Is it named and advised against?
- Is it endorsed?
Between cited and mentioned, position decides: a link placed at your mention. No judge assigns cited.
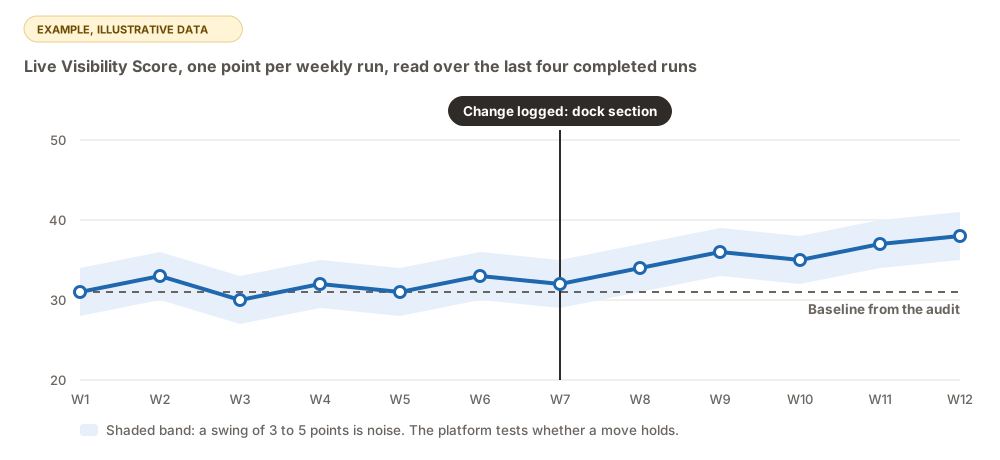
Small movements can be noise
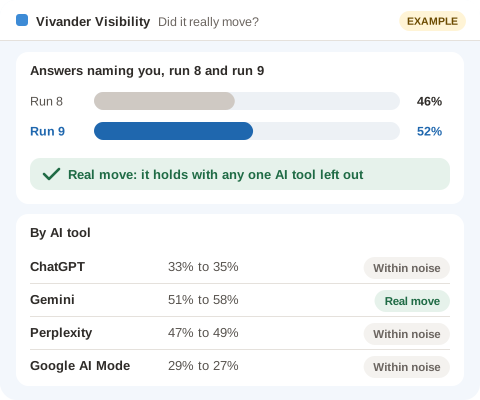
In testing, we observe that readings move from run to run with no change on your side.
How far they move depends on the metric, the number of answers and the AI tool. No single number of points applies to every reading.
The platform does not call a change from the size of a move alone. It compares the same questions on the same platforms.
It checks that the move holds without any single AI tool, and says when two readings cannot be compared.
What we do not do
- We do not claim AI visibility is deterministic. It is not.
- We do not make confident statements about AI system behavior. Retrieval, ranking and citation logic are proprietary, dynamic and undocumented.
- We report observations, not universal rules.
- We do not publish unsourced statistics about AI usage. Every claim carries a citation, a disclosed method, or an explicit "estimated" label.
Ready to see your numbers?
Start monitoring. Create an account to set up monitoring for your website.